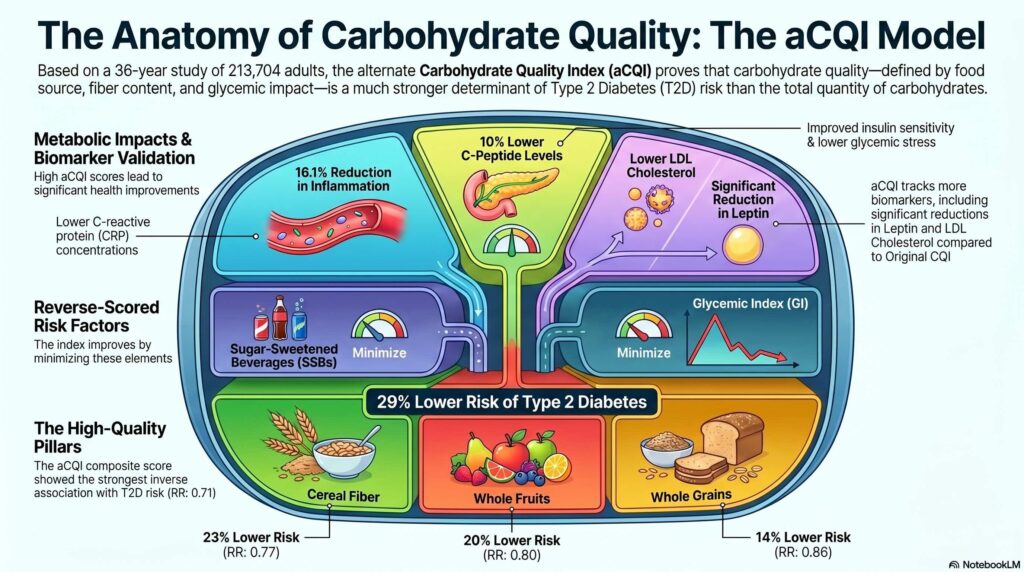
22,351 cases of type 2 diabetes documented. 213,704 adults followed for 36 years. 23 carbohydrate quality metrics tested in parallel. Harvard's conclusion is clear: what you eat in terms of carbohydrates is more important than how much you eat.
Published in April 2026 in the’American Journal of Clinical Nutrition (AlEssa et al., 2026) [1], this large-scale prospective study proposes a new composite index for carbohydrates — the alternate Carbohydrate Quality Index (aCQI) — associated with a a 29 % reduction in the risk of type 2 diabetes Compared to the lowest consumption quintile. For formulators and suppliers of carbohydrate ingredients, this is a reference framework that is worth integrating into scientific arguments right now.
The problem with existing carbohydrate metrics
The carbohydrate ingredients market is suffering from’An oversimplification. Glycaemic index, glycemic load, fibre-to-carbohydrate ratio, whole grain content: each of these metrics captures one dimension of the problem, but none covers the complexity of the metabolic risk associated with carbohydrates.
The original Carbohydrate Quality Index (CQI), developed within the SUN study [2], combined four components: total fibre intake, glycaemic index, whole grain/total grain ratio, and solid carbohydrate/total carbohydrate ratio. It has become a reference in the literature, but its associations with The risk of type 2 diabetes remained modest.
AlEssa et al. systematically compared 23 carbohydrate metrics in the NHS, NHS II, and HPFS cohorts (5,628,955 person-years of follow-up) to identify the 5 components most strongly associated with T2D risk and combine them into an optimised index.
The 5 components that make the difference
Comparing the highest quintile (Q5) to the lowest quintile (Q1) in multivariable models adjusted for BMI:
| Component | Association RR (Q5 vs Q1) | Directions |
| Cereal fibres | RR: 0.77 (95% CI %: 0.74–0.81) | Protector |
| Whole fruit carbohydrates | RR: 0.80 (95% CI %: 0.76–0.84) | Protector |
| Whole grain carbohydrates | RR: 0.86 (95% CI %: 0.82–0.91) | Protector |
| Glycaemic index | RR: 1.20 (95% CI %: 1.14–1.26) | Deleterious |
| Sugars from sugar-sweetened beverages (SSBs) | RR: 1.22 (95% CI %: 1.17–1.28) | Deleterious |
The aCQI, which combines these five dimensions, is associated with a reduction in 29 % of the risk of type 2 diabetes (RR: 0.71, 95% CI: 0.68–0.75, p-trend < 0.001), compared with 18 % for the original CQI (RR: 0.82, 95% CI %: 0.79–0.87). The difference between the two indices is not marginal.
What distinguishes cereal fibre from total fibre
One of the most operational results for formulators: Cereal fibres offer greater protection than total fibres, and it is the source – not the quantity – which determines the effect.
The original CQI used total fibres. The aCQI usesThese are cereal fibres (grains, bran, oats). The effect on T2DM is notably stronger with this specification. The authors cite several mechanisms: insoluble cereal fibres moderate satiety and weight, improve insulin resistance, and influence protein and amino acid metabolism [3]. Soluble fibres from fruits and vegetables, meanwhile, delay gastric emptying and reduce postprandial glycaemic spikes [3].
This distinction has direct implications: A «fibre-rich» ingredient is not equivalent to a «cereal fibre-rich» ingredient in a scientific argument about metabolic risk.
Fruit juice vs whole fruit: the gap is documented
The result for fruit juice is worth highlighting without equivocation. In models adjusted for BMI, carbohydrates from whole fruits are associated with 20 % for reducing the risk of type 2 diabetes (RR: 0.80). The sugars from fruit juice are associated with 14 % increase (RR: 1.14, 95% CI %: 1.09–1.19, p-trend < 0.001).
This finding is consistent with the meta-analysis by Imamura et al. (BMJ, 2015) [4], which reported an increased risk of 7 % per portion of fruit juice, regardless of body fat. The food matrix (solid vs liquid form, degree of processing) is the determining factor – not the sugar itself.
Impact on cardiometabolic biomarkers
The aCQI does not just predict the long-term risk of T2D: it is associated with significant differences in 13 cardiometabolic biomarkers. Comparing Q5 to Q1 of the aCQI, in models adjusted for BMI:
| Biomarker | aCQI Q5 vs Q1 | CQI (comparison) |
| C-peptide (insulin marker) | -10.0 % (p < 0.001) | -5,0 % |
| CRP (inflammation) | -16.1 1Q3Q (p < 0.001) | -13,9 % |
| IL-6 (inflammation) | -9.39 1Q3Q (p < 0.001) | -6,92 % |
| Leptin (weight regulation) | -6.10 % (p < 0.001) | Insignificant |
| LDL cholesterol | -4.51 % (p < 0.001) | Insignificant |
| Adiponectin | +4.43 % (p < 0.001) | +3,31 % |
What this changes for your ingredient strategy
- Made from wheat, oat beta-glucans, barley: Cereal fibre is the strongest protective component of aCQI (RR: 0.77). This body of evidence can be directly used in B2B scientific arguments.
- Whole grains the protective association is robust across the three cohorts (RR: 0.86). Refined grains show no significant association with T2D risk (RR: 1.05, p-trend = 0.24) – an argument for differentiating your whole-grain products.
- Sugars in drinks The distinction between SSB and total added sugars is notable. Sugars from sugary drinks reach RR: 1.22, compared to RR: 1.05 for total added sugars. The liquid form amplifies the detrimental effect.
- Glycaemic index The interaction with cereal fibre is significant (p-interaction = 0.017). Participants in the highest quintile for cereal fibre intake and with a low to moderate glycaemic index have a 34–37 % lower risk of T2D. For formulations aimed at promoting metabolic health, the combination of cereal fibre and a low GI is the composite target to be achieved.
FAQ — questions your R&D clients will ask you
Can aCQI be cited in a dossier for a health claim application to EFSA?
Not as a regulatory pivot — EFSA assesses claims about specific substances, not composite dietary indicators. But this body of evidence strengthens the scientific justification for individual components such as cereal fibres or beta-glucans, which already have authorised claims (e.g. oat beta-glucans, EFSA 2011).
Does the distinction between cereal fibre and total fibre change my labelling?
Not directly – European nutritional regulations still work with total fibre. However, in terms of scientific arguments aimed at formulators, the precision of the source is now a criterion for credibility.
Are potatoes really problematic?
In the BMI-adjusted models, carbohydrates from potatoes were associated with a 15 % increased risk of T2D (RR: 1.15, 95% CI %: 1.09–1.20). Pulses, on the other hand, show no significant association (RR: 1.02, p = 0.54). The distinction is not between «good starchy foods» and «bad starchy foods»: it is the fibre-to-carbohydrate ratio that makes the difference.
Is 100 % natural fruit juice comparable to sugary drinks in this respect?
As regards the risk of type 2 diabetes, the associations point in the same direction — a harmful one — although to a lesser extent than for SSBs. The meta-analysis by Imamura et al. [4] estimates an increased risk of 7 % per portion of juice, compared with 13 % per portion of a sugary drink. The liquid form and the degree of processing are more significant factors than whether the sugar is of natural or artificial origin.
Sources
[2] Zazpe I et al. Association between dietary carbohydrate intake quality and micronutrient intake adequacy: the SUN Project. Br J Nutr. 2014;111:2000–2009.
[3] Weickert MO, Pfeiffer AFH. Impact of dietary fibre consumption on insulin resistance and the prevention of type 2 diabetes. J Nutr. 2018;148:7–12.
[4] Imamura F et al. Consumption of sugar-sweetened beverages, artificially sweetened beverages, and fruit juice and incidence of type 2 diabetes. BMJ. 2015;351:h3576.
[5] Willett WC et al. Reproducibility and validity of a semiquantitative food frequency questionnaire. Am J Epidemiol. 1985;122:51–65.
[6] Yuan C et al. Relative validity of nutrient intakes assessed by questionnaire, 24-hour recalls, and diet records. Am J Epidemiol. 2018;187:1051–1063.