


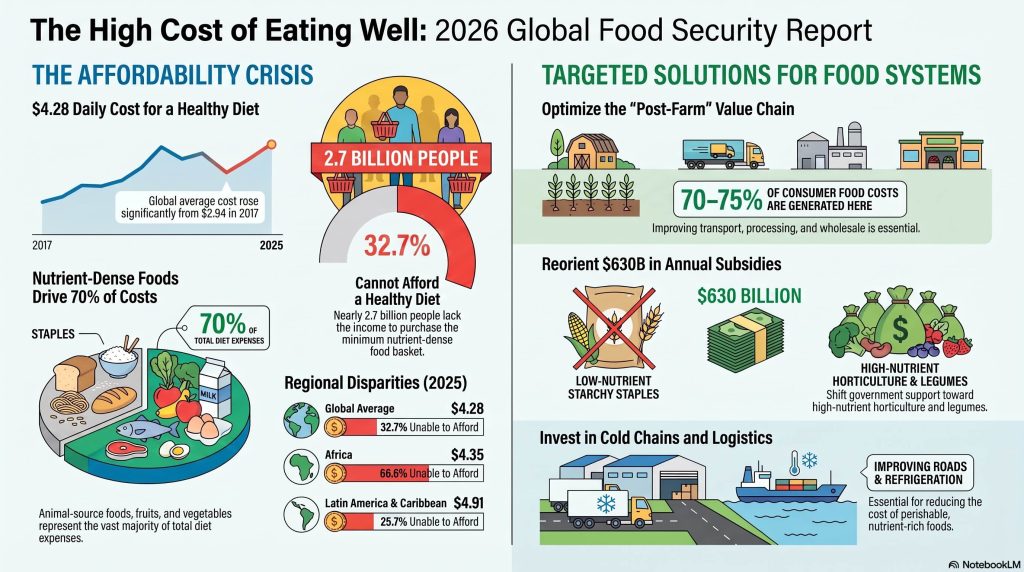
In short — The SOFI 2026 report (FAO, IFAD, WHO, WFP, UNICEF) puts the cost of a healthy diet at USD 4.28 (PPP) per day in 2025, compared with USD 2.94 (PPP) in 2017. 2.69 billion people (32.7 %) cannot afford it. Foods of animal origin, fruit and vegetables account for ~70 % of the cost, and 70 to 75 % of the final price is determined post-farm — where the R&D and logistical levers of the industry come into play.
The cost of a healthy eating reached 4.28 USD in purchasing power parity (PPP) per day in 2025, up from 2.94 USD PPP in 2017. The figure comes from the report The State of Food Security and Nutrition in the World 2026 (SOFI), published by the FAO, IFAD, WHO, WFP and UNICEF [1].
The consequence is clear: 2.69 billion people – or 32.7 % of the world’s population – will still be unable to afford a healthy diet by 2025. However, this figure has been falling since it peaked at 3.13 billion in 2020. For food manufacturers and ingredient suppliers, the key information is not the price on the label but its breakdown: where these costs arise, and therefore where they can be reduced. The report estimates that 70 to 75 % of the final price paid by consumers after The farm output – in processing, logistics and distribution. That’s your area.
What is the price of healthy eating?
The SOFI measures the minimum daily cost to purchase, locally, a basket of 11 foods spread across 6 groups, calibrated to 2,330 kcal/day. Prices are drawn from the International Comparison Programme (ICP) coordinated by the World Bank, expressed in PPP USD to compare countries with each other.
The cost structure is concentrated. According to SOFI 2026 [1], the animal products, fruits and vegetables account for around 70 % of the cost of a healthy diet, whilst starchy foods account for only around one-sixth. In other words, the most expensive food groups are also the most nutrient-dense.
| Food group | Share of global costs (%) | Energy share (%) |
|---|---|---|
| Animal-derived foods | 28 | 13 |
| Vegetables | 21 | 13 |
| Fruit | 19 | 7 |
| Starchy foods | 16 | 50 |
| Pulses, nuts, seeds | 11 | 13 |
| Oils and fats | 5 | 5 |
Source: SOFI 2026, figure 3.3, healthy food basket 2021 [1].
The imbalance is striking: starchy foods provide half the calories at 16 % of the cost, whilst animal-based foods cost 28 % for 13 % of the calories. In Africa, this group accounts for as much as 35 % of the cost of a healthy diet.
Why does the rise in cost shift the centre of gravity downstream?
The report distinguishes two structural levers for private actors: increasing the supply of accessible nutritious products, and lowering unit costs along the value chain. The second is the most actionable in the short term for a manufacturer.
The data from the analysis by Costlow et al. (2026), cited in the SOFI [1], quantify the potential savings. A 10 % improvement in the logistics performance index reduces the total cost of a healthy diet by 5.4 %, and by up to 7.9 % for oils. A 10 % increase in the road speed score reduces the total cost by 2.5 %. Conversely, a 10 % increase in GDP per capita reduces the cost by only 0.4 %.
- Logistics performance (+10 %) : –5.4 % on total cost; –6.1 % on starchy foods; –4.9 % on foods of animal origin.
- Road network (+10 %) : –2.5 1Q3Q on total costs; –3.7 1Q3Q on vegetables.
- Agricultural yields (+10 1Q3Q) : –0.5 1Q–3Q on total costs; –1.9 1Q–3Q on vegetables.
- Electricity prices (–10 %) : –0.5 % on total costs; –1.4 % on vegetables.
Logistics and transport significantly outstrip the primary production sectors. This is consistent with the fact that up to 40 % of costs are concentrated in the stages of intermediate processing, logistics services and wholesale markets.
What levers can be pulled to reduce the cost of healthy eating?
The MIRAGRODEP model adopted by SOFI tests efficiency shocks of 10 % per group and per region [1]. Two findings are of particular interest to R&D and sourcing.
First, targeting fruits and vegetables pays off. Technological interventions targeting these two groups, across all regions, reduce the cost of a healthy diet by 7.54 % relative in terms of actual consumption patterns — the gap between what people eat and what they should be eating is narrowing. Secondly, the impact of production subsidies varies significantly: –8.06 % in Latin America and the Caribbean, but only –4.4 % in Africa and –4.7 % in Asia.
Counterintuitive point: Public support for starches, which are already cheap, has a negligible effect on the cost of a healthy diet – or even a slight increase, by diverting production factors from other value chains. However, current policies (FADAPD base) almost exclusively target starches.
The value shift that manufacturers can capture
If 70 to 75 % of the price paid by the consumer is generated downstream from the farm, then the scope for action lies with ingredient suppliers and processors, not on the farm itself. The SOFI’s [1] regional priorities set out the picture: in Africa, structural transformation of the animal-sourced food sector (69 % of African countries are in the top global tertile for costs); in Asia, post-harvest handling of fruit; in Latin America — the highest average cost at 4.91 USD PPP — reducing logistical pressures on vegetables; in North America and Europe, technologies to manage high labour costs for fruit and vegetables.
Business translation: an innovation that lowers the unit cost of a nutrient-dense ingredient—accessible protein, fruit or vegetable processed without nutritional loss—tackles a market of 2.69 billion people currently excluded from a healthy eating.
The 2026 context impacting your input costs
The report names two risk factors for 2026. The conflict in the Middle East threatens progress made on hunger. And rising energy prices disproportionately inflate the cost of nutrient-rich foods, whose production relies heavily on cold chains, processing and transport.
In the background, a figure frames the issue: the hidden costs associated with diseases caused by poor nutrition are estimated at USD 8.1 trillion per year globally [1]. Making the’healthy eating Affordable is therefore not an added spiritual benefit, but a primary economic equation. For those in the nutrition sector, the operational question boils down to one thing: which of your links – sourcing, formulation, packaging, logistics – can shave the most pence off the retail price of a nutrient-dense product?
References
- FAO, IFAD, WHO, WFP & UNICEF. (2026). The State of Food Security and Nutrition in the World 2026 — The High Cost of Healthy Diets. Rome.
- FAO. (2026). SOFI 2026 — Supplementary material.
- FAO. (2026). FAOSTAT: Food security data.
- FAO. (2026). SOFI 2026, figure 2.8 — Cost and affordability of a healthy diet.
- FAO. (2026). SOFI 2026, Figure 3.2 — Cost of food groups by region.
- Costlow, L., Yenesew, S., Nakasone, E., Mamidanna, S., Gilbert, R., Martinez, E. M., Jenkins, N. & Masters, W. A. (2026). Analysis of geographic, structural, and policy associations with global variation in the cost of a healthy diet.
- Laborde, D. & Olivetti, E. (forthcoming). Beyond single interventions: A multi-region simulation of structural and subsidies policies to lower the cost of a healthy diet. For attention of.
- FAO. (2026). FAOSTAT: Cost and Affordability of a Healthy Diet (CoAHD).
FAQ
What does the figure of 4.28 USD PPP/day mean?
According to SOFI 2026, this is the minimum daily cost to buy locally a basket of 11 foods (6 groups, 2,330 kcal) making up a healthy diet, expressed in purchasing power parity to compare countries. It stood at US$2.94 PPP in 2017.
Which food groups weigh most heavily in this cost?
Foods of animal origin (28 % of global costs), vegetables (21 %) and fruit (19 %) account for around 70 % of the cost, whilst starchy foods provide 50 % of calories for just 16 % of the cost, according to the SOFI 2026.
Why is logistics the priority lever for manufacturers?
The analysis by Costlow et al. (2026), cited by SOFI, indicates that a 10 % improvement in the logistics performance index reduces the total cost of a healthy diet by 5.4 %, compared with 0.4 % for a 10 % increase in GDP per capita. Between 70 and 75 % of the final price is determined after the farm gate.
Does subsidising starchy foods reduce the cost of a healthy diet?
No. According to the MIRAGRODEP modelling of SOFI 2026, public support for starchy foods – already cheap – has a negligible effect, or even slightly increases the cost of a healthy diet by diverting production factors from other nutritious value chains.
What are the regional priorities for an ingredient supplier?
The SOFI 2026 identifies: in Africa, the processing of animal-sourced foods (69 % of countries in the highest-cost tertile); in Asia, post-harvest handling of fruit; in Latin America (4.91 USD PPP, the most expensive), vegetable logistics; in North America and Europe, controlling labour costs.
What is the potential market for healthier, more affordable food?
According to the SOFI 2026, 2.69 billion people (32.7 % of the world’s population) could not afford a healthy diet in 2025, down from a peak of 3.13 billion in 2020. In Africa, the proportion stands at 66.6 %, more than double that of Asia (28.9 %).
Is targeting fruits and vegetables profitable in R&D?
According to the simulation cited by SOFI 2026, technological interventions on fruit and vegetables, across all regions, reduce the cost of a healthy diet by 7.54 % relative to actual consumption patterns — the best ratio among the groups tested for an efficiency shock of 10 %.