

-1.jpg)
En bref — The PIMENTO study (COST Action CA20128), conducted on 12,646 adults across 53 countries using the validated 3FQ questionnaire, shows that fermented dairy products are consumed by 94 to 96% of Europeans (66.7 to 80.1 g/day), compared to near-zero intake for fermented vegetables and legumes (4.4 to 8.4 g/day). Fermented plant-based alternatives reach up to 72.8% of consumers in Western Europe, but for a median of just 25.5 ml/week.
Fermented foods in Europe fall into two commercial categories: those that everyone actually consumes, and those that everyone talks about. The PIMENTO mapping study, published in 2026 in the British Journal of Nutrition based on 12,646 adults in 53 countries, puts a figure on this gap [1]. Fermented dairy products: 94 to 96% prevalence, 66.7 to 80.1 g/day. Fermented vegetables and legumes, the stars of the “gut health” aisle: 4.4 to 8.4 g/day. The gap between what sells as a narrative and what is consumed in grams now has a measure.
The verdict: stated adoption guarantees no volume
The PIMENTO study, run under COST Action CA20128 and coordinated by the team of Emmanuella Magriplis (Agricultural University of Athens), surveyed 12,646 adults across four European regions using the Fermented Food Frequency Questionnaire (3FQ), a validated tool covering 15 categories of fermented foods [1]. The most telling result for your product ranges comes down to a disconnect.
Consumption prevalence and the volume actually swallowed vary independently. Fermented plant-based alternatives reach up to 72.8% of consumers in Western Europe, meaning seven people out of ten. Their median intake: 25.5 ml per week. People buy them, taste them, then leave them at the back of the fridge.
Conversely, non-alcoholic fermented beverages (kombucha, water kefir) reach only 18 to 49% prevalence depending on the region, but those who drink them consume 19 to 50 ml per week [1]. A committed consumer, a narrow base. For your R&D, the lesson is blunt: a category’s penetration rate does not predict its tonnage. A product “tried by 70%” can weigh less than a product “adopted by a loyal 20%.”
Why does this mapping of fermented foods in Europe arrive now?
Before PIMENTO, data on fermented food consumption in Europe remained fragmented: single-country or single-product studies, incompatible methodologies. The EPIC-InterAct study does apply standardised methods, but captured only limited characteristics of fermented foods [1]. Under these conditions, comparing Poland to Greece or building a cross-border health claim was impossible.
The 3FQ changes the scale of measurement. It is the first tool designed to assess habitual consumption of a wide range of fermented categories across several European countries, translated into 28 languages and validated beforehand [2]. Its repeatability (n = 2,315) shows Spearman correlations of 0.6 to 0.8 for most groups, and its agreement with 24-hour recalls exceeds 90% for dairy products, coffee and bread [2].
What arrives now is a harmonised reference dataset. For your regulatory affairs teams, this is the foundation that was missing to link a level of exposure to a measurable health benefit. The authors say so plainly: harmonised dietary monitoring protocols are needed to close the current gap [1].
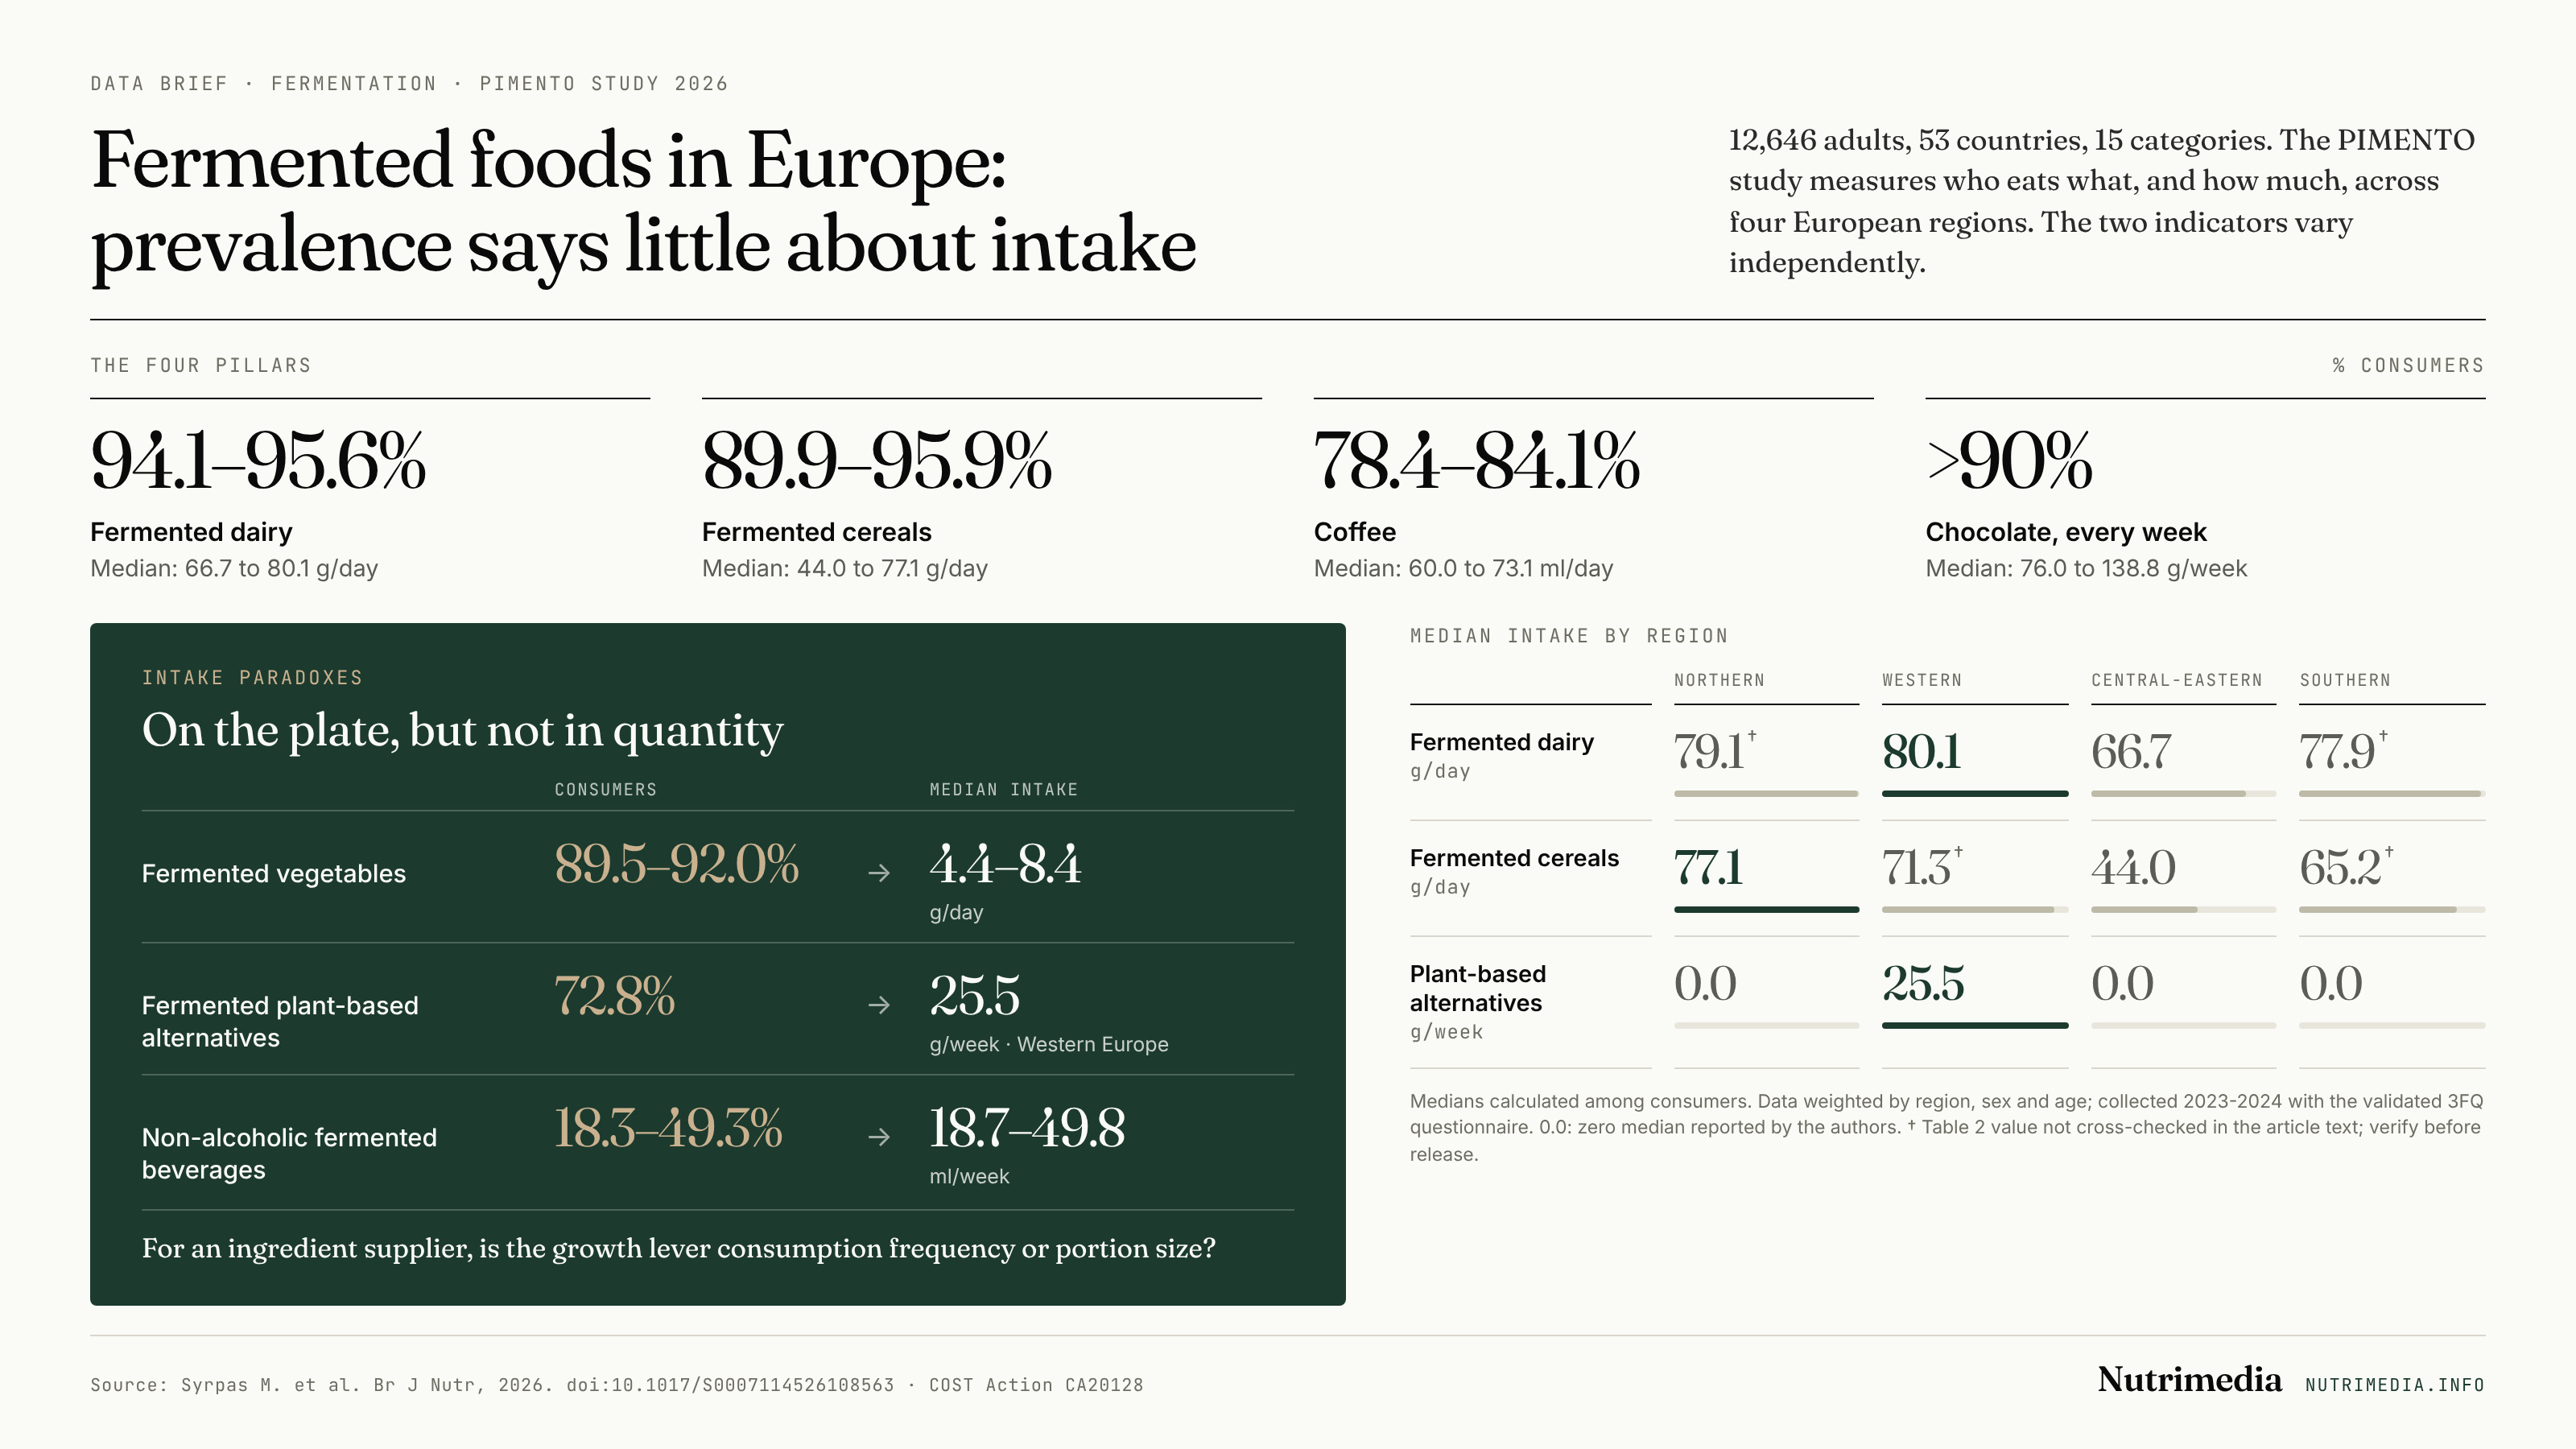
Which categories really carry weight in fermented foods in Europe?
The PIMENTO mapping arranges the 15 categories of fermented foods in Europe along two axes: prevalence (who consumes them) and median intake among consumers (how much). Cross-referencing the two reveals the two-speed market.
| Category | Prevalence | Median intake (consumers) | Market profile |
|---|---|---|---|
| Fermented dairy products | 94.1 to 95.6% | 66.7 to 80.1 g/day | Mass volume |
| Fermented cereals (bread) | 89.9 to 95.9% | 44.0 to 77.1 g/day | Mass volume |
| Coffee | 78.4 to 84.1% | 60.0 to 73.1 ml/day | Mass volume |
| Fermented vegetables | 89.5 to 92.0% | 4.4 to 8.4 g/day | Broad but marginal in volume |
| Plant-based alternatives | up to 72.8% (West) | 25.5 ml/week | Trial without loyalty |
| Non-alcoholic fermented beverages | 18.3 to 49.3% | 18.7 to 49.8 ml/week | Niche with loyal base |
The case of fermented vegetables deserves a pause. Their prevalence is high (nearly nine out of ten Europeans consume them), but intake plateaus at 8.4 g/day in Southern Europe and drops to 4.4 g in Western Europe [1]. A portion of sauerkraut or kimchi once a week, at a homeopathic dose. The “microbiome” enthusiasm driven by marketing has not translated into grams on the plate. For your marketing teams, this figure reframes any health benefit promise: at these doses, exposure to live micro-organisms remains modest.
On the beverage side, regional heterogeneity is strong. Wine ranges from 12.5 ml/day in Central-Eastern Europe to 25.0 ml/day in Western Europe; beer and cider from 25.0 to 50.0 ml/day [1]. Nutrimedia excludes any communication on alcohol, but these figures situate the relative weight of non-alcoholic fermented categories within the European basket.
What barriers exist before leveraging this data in your innovation pipeline?
The PIMENTO data on fermented foods in Europe are robust, but their limitations must frame your decisions. The authors list them without varnish, and three directly concern your teams [1].
- The 3FQ does not distinguish products by country or brand. It captures neither the level of processing nor post-fermentation treatments such as pasteurisation. A live yoghurt and a product fermented then heat-treated fall into the same bucket. For a “live microbes” claim, this granularity is missing.
- Microbial counts at the point of consumption are not measured. The study maps grams, not CFUs. Linking intake to health benefit will require combining this data with microbial profiling, which the authors defer to future multi-omics work.
- Sampling is convenience-based, with female over-representation (65 to 71% depending on the region) and over-representation of higher-education graduates. Intake medians should therefore be read as comparative orders of magnitude, not as strict population averages.
The practical workaround: use PIMENTO to prioritise categories, not to size a business plan down to the gram. Cross-reference these medians with your own sell-out data by market before any investment decision.
Prevalence or tonnage: the wrong indicator is costly
Many “gut health” launches are steered by trial rate. PIMENTO shows that trial does not make volume: 72.8% of consumers of fermented plant-based alternatives for 25.5 ml/week [1]. Before scaling up capacity, settle on the real KPI for the targeted category: broad penetration at low dose (a shelf-visibility logic) or a narrow base of loyal, high-usage consumers (a purchase-frequency logic). The two call for different formats, different pricing and different messaging.
What the mapping of fermented foods in Europe reshuffles for your decisions
For your R&D, procurement and marketing decisions, PIMENTO provides an allocation filter. Volume categories (dairy, cereals, coffee) are mature and saturated: innovation here plays out on differentiation, not usage conquest. Narrow-base, high-usage categories (non-alcoholic fermented beverages) offer a frequency lever among consumers already engaged.
Fermented vegetables and plant-based alternatives raise the most strategic question: how to convert broad adoption into recurring volume? At 4.4 to 8.4 g/day for fermented vegetables, the room for portion growth is real, but it requires removing the usage barrier (taste, format, consumption occasion), not merely recruiting new buyers [1].
On the regulatory front, the authors note that no nutritional recommendation specific to fermented foods yet exists, although several countries are considering one. Their conclusion: region-by-region guidance and food-environment strategies will be more realistic than a pan-European recommendation [1]. For your public affairs teams, the playing field for the coming years is national, not continental.
What remains is the real question for your portfolio: will your next fermented launches target the prevalence that reassures dashboards, or the tonnage that builds margins?
Références
- Syrpas M, Magriplis E, et al. Mapping fermented food prevalence and intake across European regions: results from the Promoting Innovation of Fermented Foods (PIMENTO) study. British Journal of Nutrition. 2026. DOI: 10.1017/S0007114526108563
- Magriplis E, Smiliotopoulos T, Myrintzou N, et al. Validation of the fermented food frequency questionnaire to assess consumption across four European regions. Frontiers in Nutrition. 2025;12:1667653.
- COST Action CA20128. Promoting Innovation of ferMENTed fOods (PIMENTO). COST. Accessed February 2026.
FAQ
What is the PIMENTO study and the 3FQ questionnaire?
PIMENTO is a COST action (CA20128) that mapped fermented food consumption among 12,646 adults in 53 European countries, with data collected between October 2023 and May 2024. The tool used, the 3FQ, is a validated frequency questionnaire covering 15 categories of fermented foods, translated into 28 languages, according to the article published in the British Journal of Nutrition (2026).
Why do fermented vegetables show high prevalence but low volume?
According to PIMENTO (2026), nearly nine out of ten Europeans consume fermented vegetables, yet median intake does not exceed 4.4 to 8.4 g/day. Widespread adoption therefore does not translate into tonnage: consumers eat them rarely and in small quantities, which limits actual exposure to live micro-organisms.
Do fermented plant-based alternatives represent a genuine volume market?
Not yet, according to PIMENTO. They reach up to 72.8% of consumers in Western Europe, but for a median intake of only 25.5 ml/week. The industrial challenge is not recruiting buyers, which is already high, but converting trial into recurring consumption.
Can PIMENTO data be used for a health claim?
With caution. The 3FQ measures grams consumed, not viable microbial counts at the point of consumption, and does not distinguish products pasteurised after fermentation. Linking intake to health benefit will require combining this data with microbial profiling, which the authors defer to future work. Any claim remains governed by Regulation (EC) 1924/2006 and the EFSA register.
Is there a European nutritional recommendation on fermented foods?
No. The PIMENTO authors note that no specific recommendation exists to date, although several countries are considering one. They judge region-specific guidance more realistic than a pan-European recommendation, given the regional heterogeneity observed.
Which categories of fermented foods are most consumed in Europe?
According to PIMENTO (2026), fermented dairy products dominate with 94.1 to 95.6% prevalence and 66.7 to 80.1 g/day, followed by fermented cereals (89.9 to 95.9%) and coffee (78.4 to 84.1%). These are the only three categories reaching a daily intake classed as moderate.